
Early access For trucking carriers

The fleet analyst you don't have to hire.

Most owners don't have hours to dig through loads, costs and trucks. Fleet Strategy does it for you, on top of your TMS, and shows you what needs a decision: the cancellation fees nobody billed, the costs paid twice, the trucks sitting idle, the customers paying below their usual rate.

No switching. Your team keeps working in your TMS exactly as it does today.

What needs a decision

It doesn't just show numbers. It points at what to do about them.

Fleet Strategy goes through the company's loads, trucks and costs and brings up the money leaking out. Every finding comes with the records behind it, one click away, so you can check it in a minute and make the call.

Cancellation fees nobody billed

Every cancelled load where a truck was already assigned or driving, the fee billed or never billed, the empty drive to a pickup that never happened, the truck time lost, and the customers who cancel most.

Found
Customer A cancelled 6 loads with a truck already on the way. No fees billed, about $1,800.
The decision
Bill the fee next time, and raise it before booking their next load.
Costs paid twice, or not at all

Dozens of checks across loans, insurance, registration, permits, fuel tax and the office. A truck on two policies, a quarter with trips but no fuel tax return, a load that needed a permit nobody recorded.

Found
Trucks 214 and 215 are on two insurance policies for the same months. The company pays for them twice.
The decision
Drop the duplicate cover and ask for the overlap back.

Trucks and trailers that sit

A truck without trips still costs its payment, insurance and its share of the office. Every truck and trailer that sat in the dates you pick, and what each one cost.

Found
3 trucks had no trips last month. Together they cost the company $11,800.
The decision
Put them to work, hand them to a driver, or return or sell them.

Customers paying below their usual rate

What each customer pays per mile, compared to the company's own usual rate for the same equipment and distance, month by month.

Found
Customer B paid 14% less per mile than its usual rate for three months.
The decision
Take it to the next rate talk, or give those trucks to customers who pay.

Example figures. Customer and truck names are made up.

Hand it off

Knowing your numbers shouldn't be a second full-time job.

Fleet Strategy does the digging an analyst would do, so the owner only steps in to decide.

1

Set up with you

We connect your TMS and enter the fixed costs with you on a call, then check the figures against your own records before you log in.

2

Keeps itself current

New and changed records come in automatically. There's no spreadsheet to update and no report to rebuild.

3

Checks itself

Dozens of cost checks, flags on records that look wrong, and every report checked when it's rebuilt. Problems come to you.

4

Open it to decide

Home shows how the company did and who to look at. One click opens the list, one more opens the records behind it.

Market analytics

See the country the way your trucks see it.

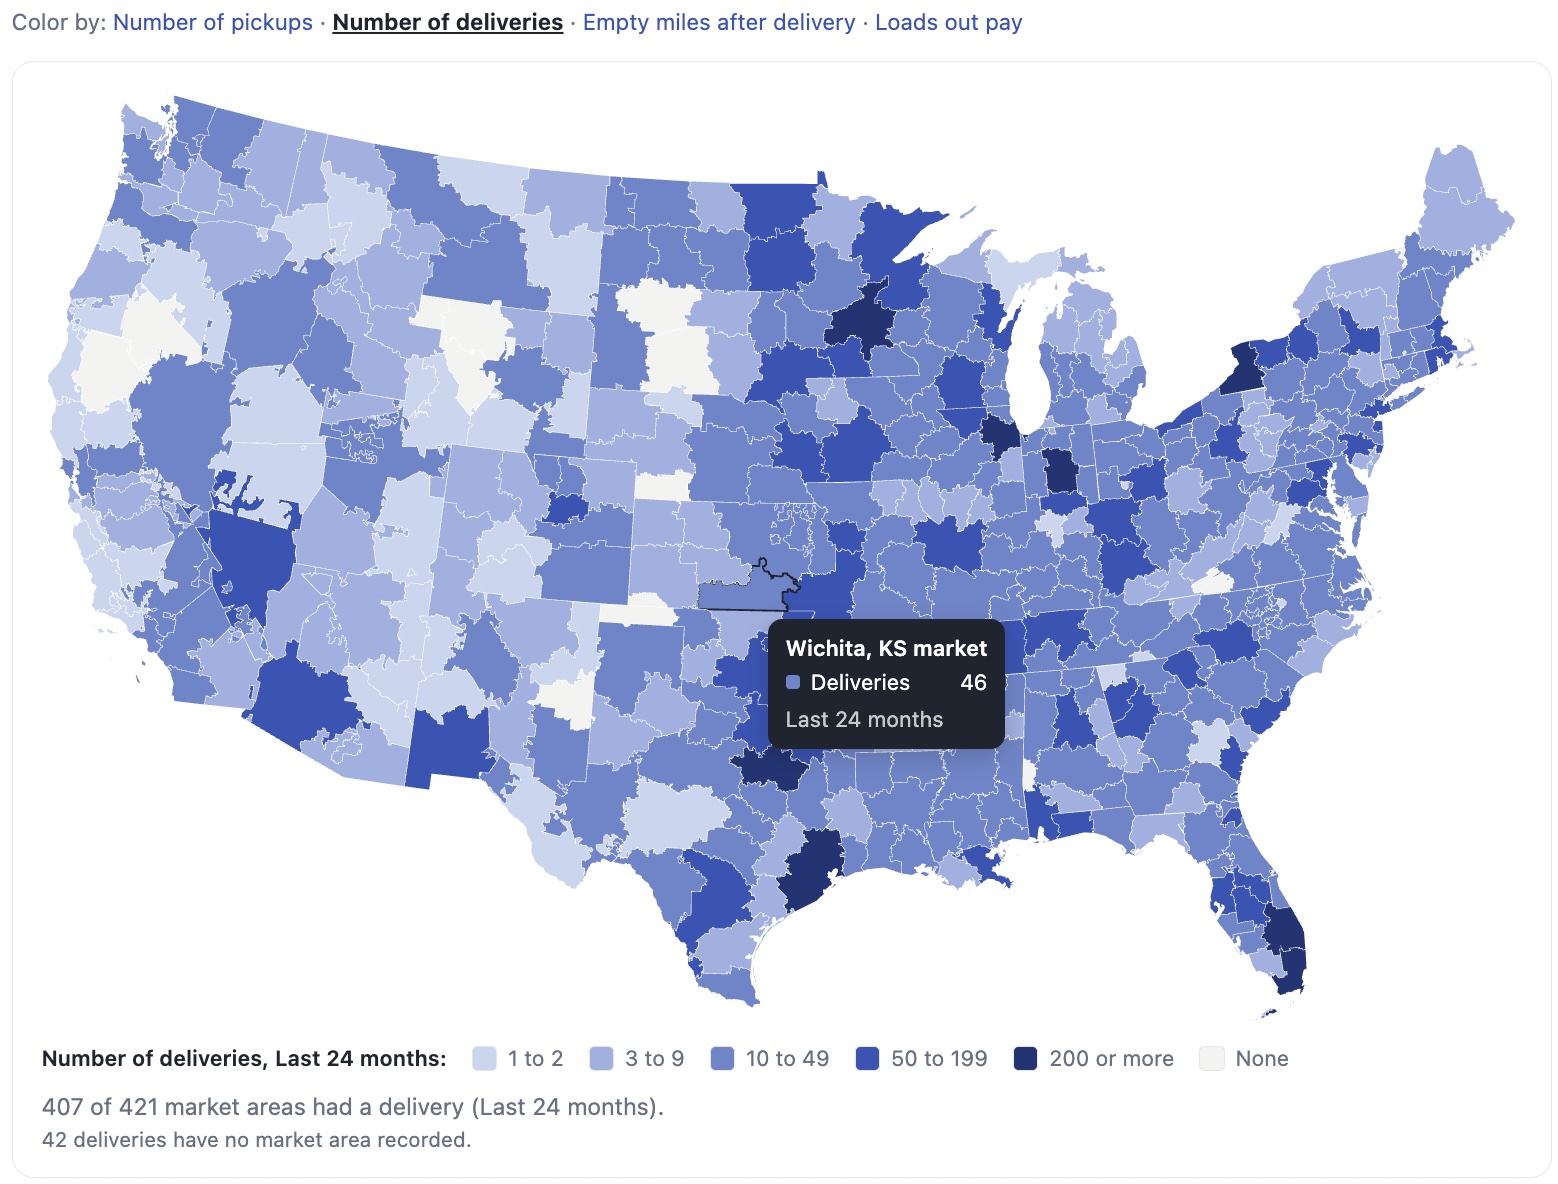
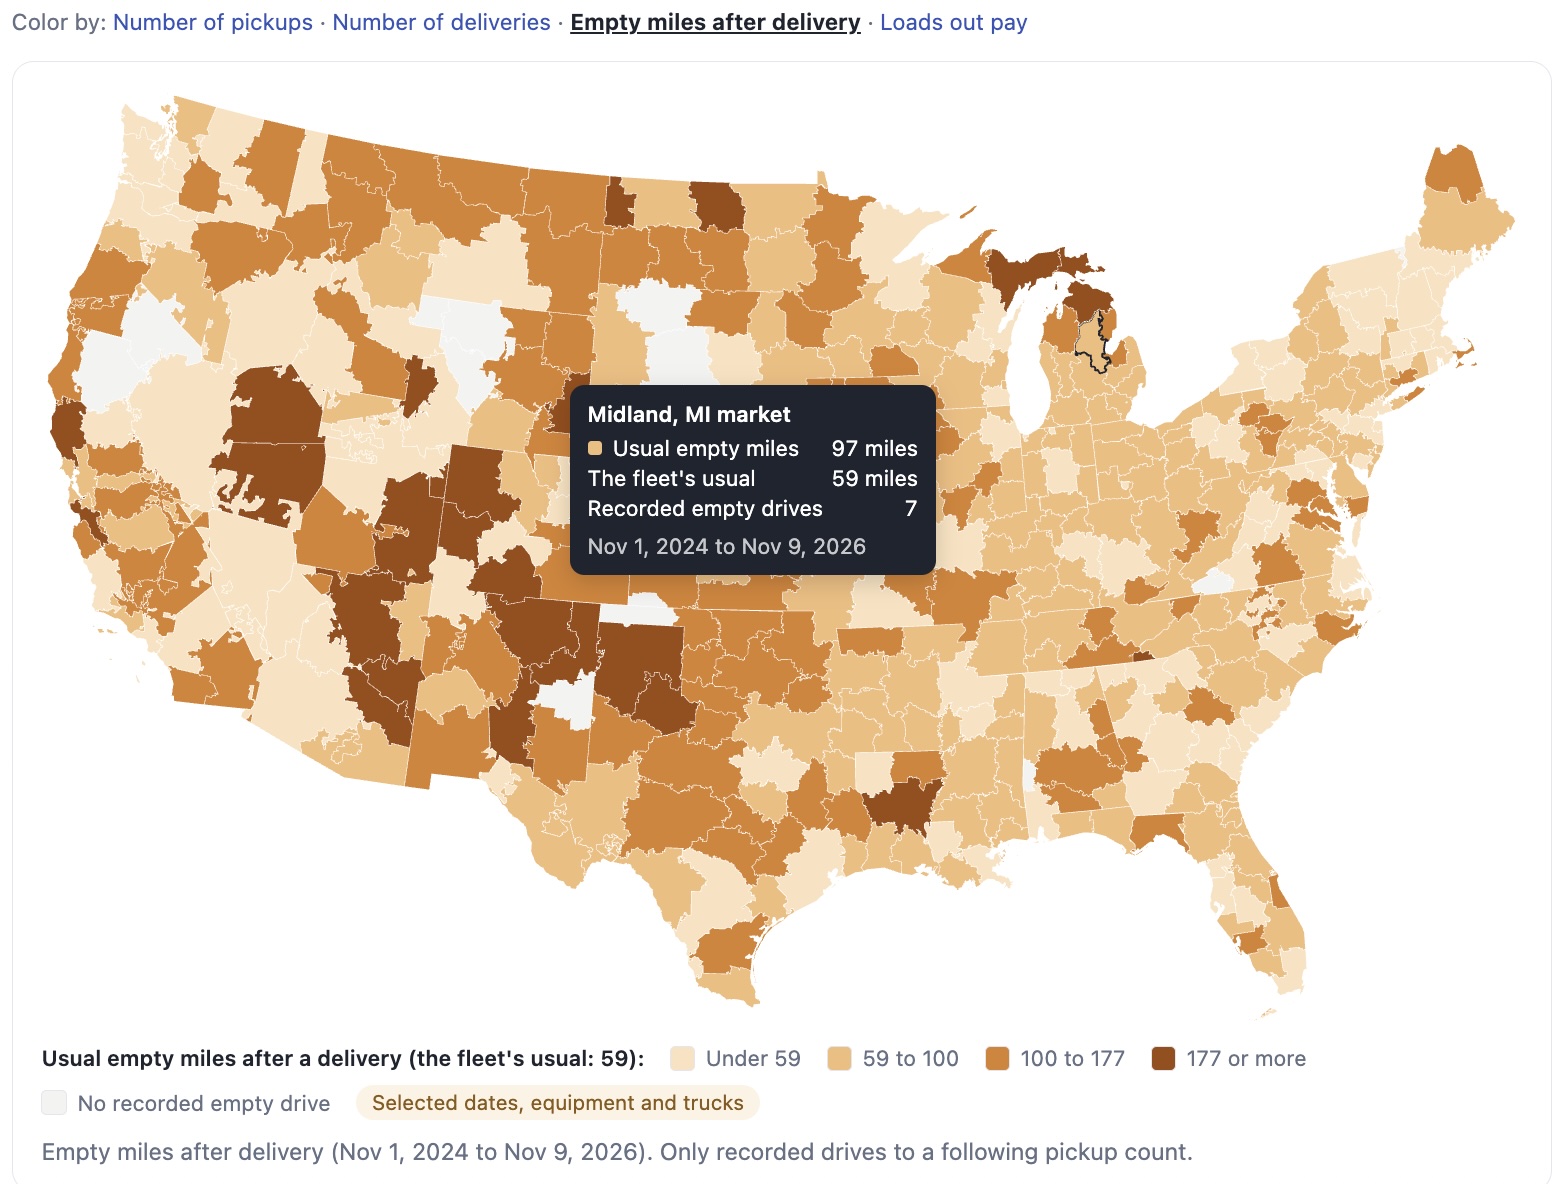
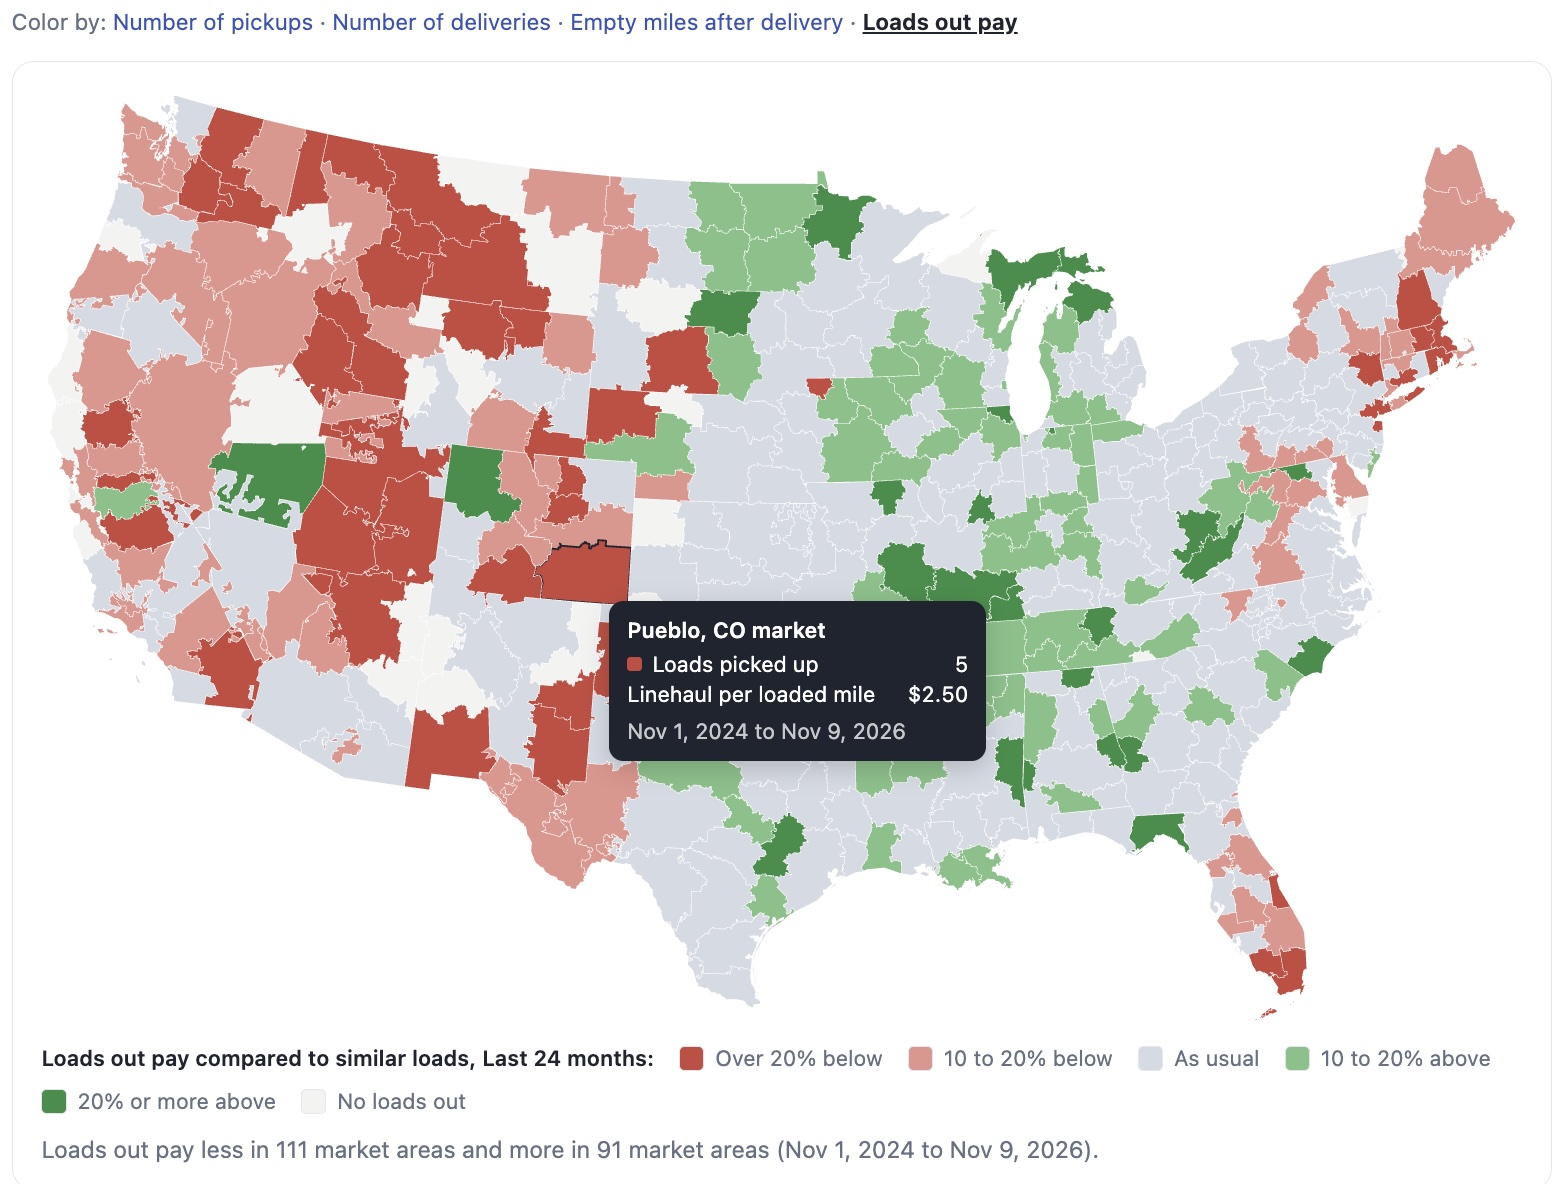
Know which markets are worth the trip before you book it. Price loads into weak markets so they cover the way back, keep trucks where freight goes out, and see who shipped out of an area last time, so the next load is a phone call instead of a load board search.

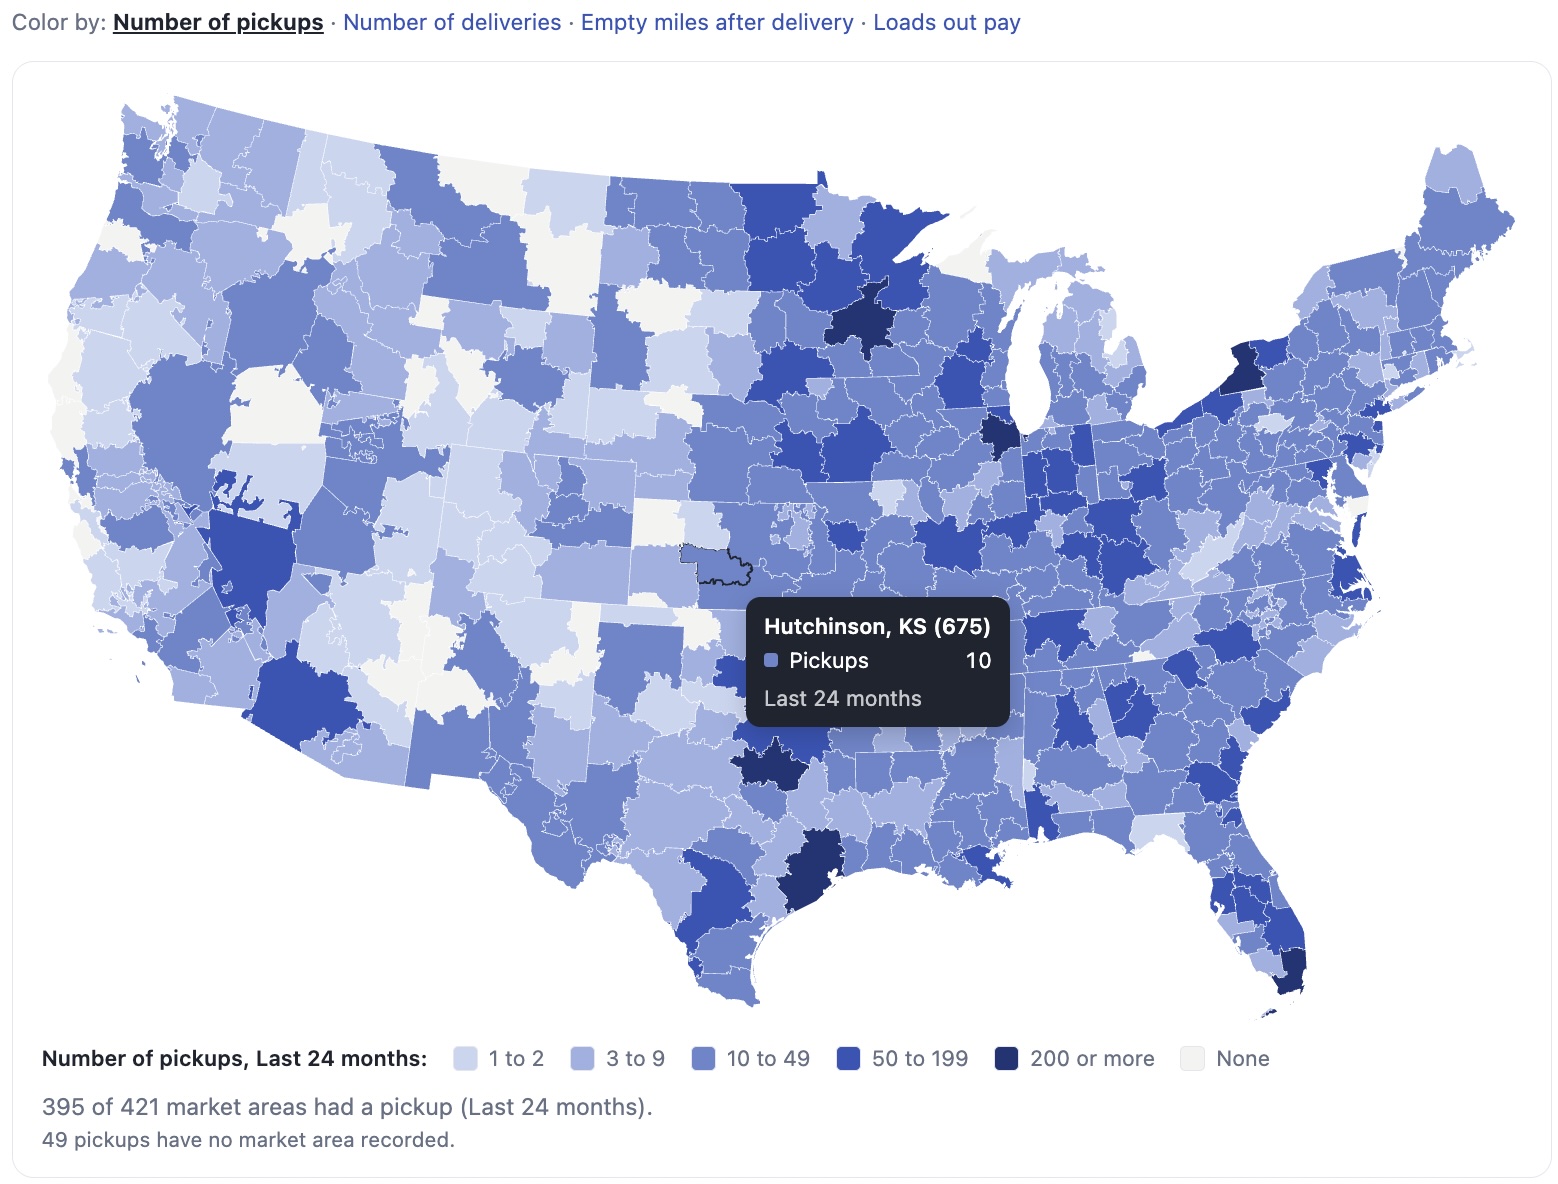
Screens from Fleet Strategy's Market areas page. Hover any area in the app to see its figures, or open it for its customers and lanes.

Map of US market areas shaded by number of pickups in the last 24 months, from 1 to 2 up to 200 or more.
Where the fleet's freight starts. The darker the area, the more loads were picked up there.
Decisions it changes

Better calls on what to book, who to coach and how to pay.

Price the trip in to cover the way back

Some markets are easy to reach and hard to leave. Market areas shows where loads out pay less than usual and where trucks drive far empty after a delivery, and charges those empty miles to the load that went there. Each area lists the customers who shipped out of it before, with a Call button, so the dispatcher isn't starting from the load board.

Compare dispatchers fairly

Whose loads pay and leave the most, compared within each kind of equipment and per truck hour. A second margin counts costs the same way whoever paid them, so a dispatcher booking owner-operator trucks isn't penalised.

Pay drivers on what they bring in

Each driver's pay per mile beside pay as a share of revenue, with driver pay checked trip by trip against the TMS.

Keep the lanes and trucks that earn

Every lane sorted by margin, and every truck's profit per mile after its share of fixed costs, with its repairs beside it.

Judge the round trip, not the load

Example figures
Miami, FL Freight desert
Loads in pay
$2.90 a mile
Loads out pay
$1.70 a mile Loads out pay less
Empty miles after delivery
118 mi fleet 61 mi

One round trip through Miami

Load in, 660 mi
$1,914
Load out, 640 mi
$1,088
Cost to run 1,418 mi, empty miles included
−$2,751
Round trip
+$251
A load into Miami can look cheap on its own and still be the right call. What matters is the round trip, so the load in is priced knowing what the load out will pay. Cost to run is $1.94 a mile.

Works on top of the TMS you already use.

No switching

Keep running the business in your TMS. Fleet Strategy reads from it automatically and never changes anything in it.

Your numbers, not averages

Every figure comes from the company's own loads and costs, compared to its own fleet and its own history, not a market report.

Kept separate

Each company's data lives in its own space, and every request is limited to that company's records.

Everything in one place

And every number behind it.

Pick the dates, the kind of equipment and company or owner-operator trucks once. Every page follows, and every view is a link you can share.

  • Fleet economicsRevenue, costs, margin and profit, per mile and per hour
  • Market areasWhich markets pay, and the freight deserts
  • CustomersRate compared to usual, and cancellations
  • LanesCity to city or market to market
  • DispatchersMargin per mile and per truck hour, and commission
  • DriversMiles, revenue, margin and pay
  • TrucksProfit after fixed costs, repairs, idle days
  • TrailersCost per mile, and the ones that sit
  • Owner-operatorsWhat each one leaves the company
  • Cancelled loadsFees, empty drives and truck time lost
  • CostsLoans, insurance, registration and 11 more, with checks
  • Fuel tax (IFTA)Every quarter, with a flag when a return is missing

On the way: a short list on Home of what needs a decision, each with its dollars and the records behind it, plus round-trip profitability.

Numbers you can check

Built so an owner can follow every figure.

If a number can't be traced back to the company's own records, it doesn't belong on the screen.

Fixed costs spread fairly

A truck payment or an insurance bill is spread over the days it covers, so one big bill never makes a week look terrible and the next look great.

Shared costs, shown

Office and company costs are split across the trucks day by day, and every page says how much of its cost is shared.

Comparisons that mean something

Every figure sits beside the period before and the fleet, within the same kind of equipment. A change under 2% reads as level, and the number of loads behind a claim is shown.

Corrections you can undo

Change a truck's owner, a trailer, or a driver's pay by hand, and Undo is right beside it. Changes made by hand survive every refresh.

Flagged, never hidden

Records that look wrong are kept and marked, with the rows behind each flag one click away, instead of being quietly dropped.

Checked before it shows

Every report is checked when it's rebuilt. If one fails, pages keep the last good numbers and say so.

How it works

We set carriers up one at a time.

Setup is done with you, not handed to you.

Request access

Tell us about the fleet. We get back to you and set up the company's account.

Connect your TMS

We connect with an API key from your TMS and download your history of loads, trips, fuel, tolls and maintenance.

Add fixed costs together

Truck and trailer loans, insurance, registration, rent and the rest, entered with us on a call.

Check, then open it any time

We check the figures against your own TMS before you log in. After that, it keeps itself up to date.

FAQ

Questions carriers ask.

Does Fleet Strategy replace our TMS?

No. Your team keeps dispatching in your TMS. Fleet Strategy reads from it and shows what the TMS can't: what each truck, customer, market and cancellation really costs and earns.

We don't have time for another dashboard. Is this one more thing to watch?

No. Fleet Strategy keeps itself current and checks itself. Home shows how the company did and who to look at, so you open it to make a call, not to dig.

Who is it for?

Trucking carriers in the US running roughly 50 trucks or fewer, and the owners and managers who need to know which work pays.

Which TMS do you work with?

We're connecting TMS platforms one at a time. Tell us which TMS you use in the form below, and we'll tell you whether it's supported yet.

How up to date are the numbers?

Fleet Strategy picks up new and changed records from your TMS automatically. When you change a cost or make a correction, press Recalculate and the reports update without waiting for the next sync.

What do we need to do?

Create an API key in your TMS and spend a call with us entering your fixed costs. That's it.

Is our data safe?

Each company's data is kept in its own separate space, and Fleet Strategy only reads from your TMS. We're happy to walk through the details on a call.

How much does it cost?

Fleet Strategy is in early access, and we're setting carriers up one at a time. Request access and we'll talk through what fits your fleet.

Early access

See your own numbers.

We're onboarding a small number of carriers and setting each one up personally.

  • A setup call with the team that builds it
  • Your own figures, checked against your records before you log in
  • No change to how your team works